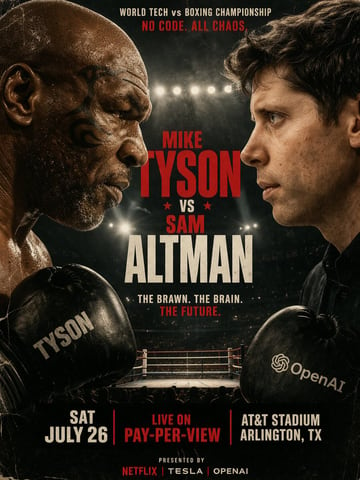
Image2Studio
Examples

gpt-image-2

Editorial Infographic Dual-axis Line Chart

Ready-to-edit editorial infographic dual-axis line chart image prompt.

Ready-to-edit editorial infographic dual-axis line chart image prompt.
Prompt

{ "type": "editorial infographic dual-axis line chart", "style": "clean, newspaper-style, off-white background, highly legible typography", "header": { "category": "CRIME, SAFETY & JUSTICE (red text with red square icon)", "headline": "{argument name=\"main headline\" default=\"Crime is down 50% since 1993. Most Americans think it's going up. Both true simultaneously.\"}", "sub_headline": "US VIOLENT CRIME RATE vs PUBLIC PERCEPTION · 1990-PRESENT · BJS/FBI + GALLUP" }, "chart": { "x_axis": "Years 1990 to 2024 with 8 tick marks", "left_y_axis": { "color": "blue", "label": "{argument name=\"left axis label\" default=\"VIOLENT CRIME RATE per 100,000 people\"}", "range": "200 to 800" }, "right_y_axis": { "color": "red", "label": "{argument name=\"right axis label\" default=\"% OF AMERICANS WHO SAY 'CRIME IS UP FROM LAST YEAR'\"}", "range": "20% to 80%" }, "data_series": [ { "name": "Reality", "style": "solid blue line", "trend": "peaks early then drops significantly", "annotations": [ "1993 PEAK 747 violent crimes per 100,000 (with blue dot)", "REALITY: Crime Has Fallen (with blue arrow pointing to line)", "2024 376 per 100,000 ~50% LOWER than 1993 (with blue dot)" ] }, { "name": "Public Perception", "style": "dashed red line", "trend": "remains relatively flat and high", "annotations": [ "PUBLIC PERCEPTION: Remains High... (with red arrow pointing to line)", "2024 62% think crime is up (with red dot)" ] } ] }, "callout_box": { "position": "bottom left inside chart area", "style": "light yellow rectangle", "icon": "lightbulb", "text": "{argument name=\"callout text\" default=\"The crime rate and the public's feeling about crime have almost no relationship.\"}" }, "footer": { "text": "SOURCE: {argument name=\"footer source\" default=\"Bureau of Justice Statistics NCVS · FBI Uniform Crime Reports · Gallup Crime Poll\"}" } }

Prompt structure
  • Modelgpt-image-2
  • Use casesocial-media-post
  • Styleminimal, editorial
  • Aspect ratioFlexible
Best used for
  • Use casesocial-media-post
  • Styleminimal, editorial
  • Recommended specs1:1, 4:5, 16:9, or 9:16
  • ModelGPT Image 2
How to customize

Use this Editorial Infographic Dual-axis Line Chart prompt as a base. Replace the subject, product details, environment, lighting, brand colors, and output ratio while keeping the social-media-post intent and minimal, editorial direction stable.

Editable variables
  • SubjectReplace the product, person, scene, interface, or object being generated.
  • Use caseKeep or rewrite the destination as social media post, ad creative, cover image, poster, or ecommerce hero.
  • FrameChoose 1:1, 4:5, 16:9, or 9:16 based on the final placement.
  • Brand cuesAdd colors, materials, props, text-safe space, and the platform where the image will be used.
Recommended specs

Choose the frame for the destination first, then use 1K, 2K, or 4K based on output quality needs. Product images and posters usually benefit from higher resolution.

Pre-generation checklist
  • CheckSubject, lighting, composition, and frame are specific enough to review.
  • CheckText-safe space is included when the image will carry a headline or ad copy.
  • CheckResolution, credit cost, and final destination are checked before generation.
Why this prompt works

Editorial Infographic Dual-axis Line Chart works because it starts from the image job, then controls subject, composition, lighting, style, and frame. It is best for social media post while keeping the minimal, editorial direction stable.

Common questions
  • Can I use it directly?Yes. Replace the subject, brand cues, and frame, then generate in Image2Studio.
  • Which ratio should I use?Choose 1:1, 4:5, 16:9, or 9:16 based on the destination.